
Publications > Summary
Executive summary: Mental maps of rural producers on land use change in MATOPIBA
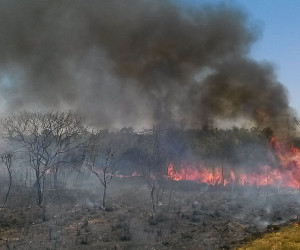
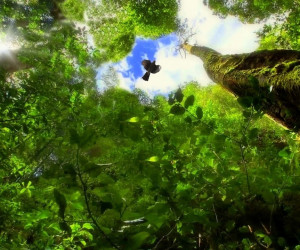
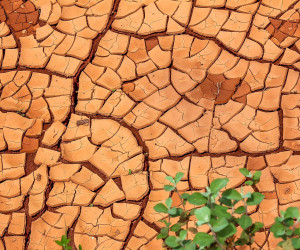
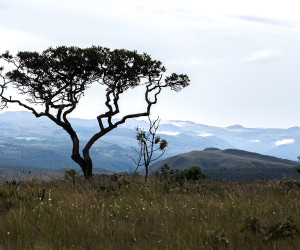
Most of the agricultural expansion in MATOPIBA has occurred over native vegetation, unlike in other areas of the Cerrado where crops are being established on pasturelands. This indicates that approximately two-thirds of the current native vegetation cover in the Cerrado, suitable for agriculture, is at risk of being converted for other uses, primarily soybean cultivation.
Therefore, efforts should be directed towards implementing policies aimed at reducing legal deforestation and encouraging voluntary conservation of native vegetation. Besides the environmental and climate benefits, this approach ensures access for Brazilian producers to markets demanding deforestation-free commodities.
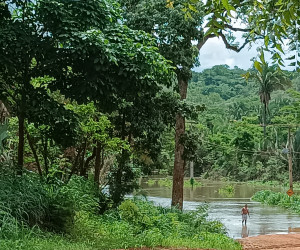
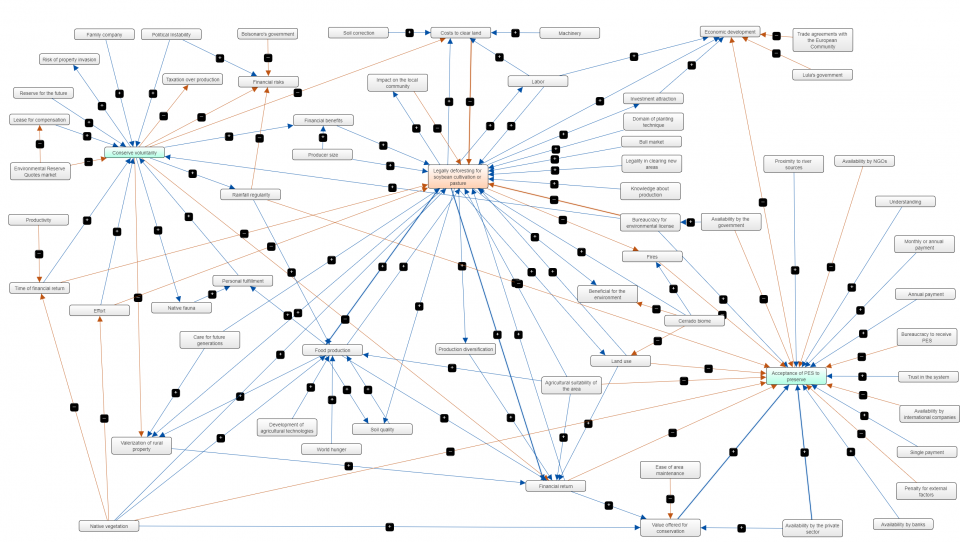
Conducted under the project “Incentives and Interventions for Behavior-Based Policies in a Sustainable and Deforestation-Free Soy Supply Chain in the Cerrado,” in partnership with the Center for Conservation and Sustainability Sciences at PUC-Rio (CSRio) and funded by the Land Innovation Fund (LIF), this research aimed to identify and evaluate the behavioral factors influencing land-use decisions among rural producers in MATOPIBA. For this purpose, mental maps of different producer groups in the region were generated, based on 60 interviews conducted between August and December 2022 in the states of Maranhão, Tocantins, Piauí, and Bahia.
In some cases, there were divergent opinions among the interviewees due to varying contexts, local vegetation types, and producer profiles. This becomes evident, for example, in the perception of the Cerrado’s soil quality, which is considered fertile in some regions and less fertile in others.
The results will support the development of solutions and incentives to eliminate deforestation from the soy supply chain in the Cerrado.
Related collaborators (4)
Related Partners (3)